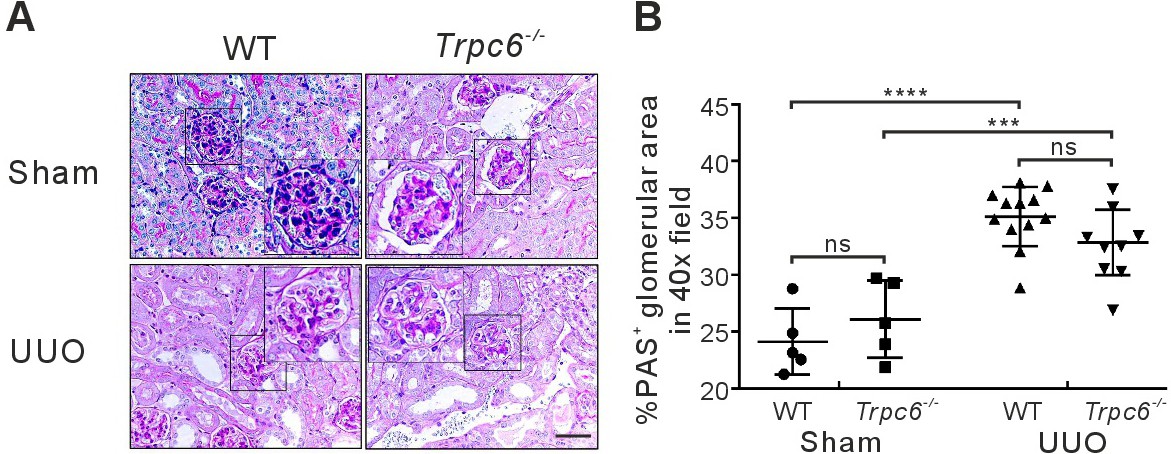
Fig. 1. PAS stained kidneys. (A): Kidneys stained with the periodic acid Schiff (PAS) stain to detect glomerular damage. (B) Quantification of the PAS positive areas in the kidneys. All images were taken at a magnification of 40x. Scale bar: 50 μm. All values are means ± SD. ns p>0.05, ***p<0.001 and ****p<0.0001. Wild type (WT) and Trpc6-/- sham groups included n=5 kidney samples each. WT and Trpc6-/- UUO-treated groups encompassed n=12 (WT) and n=11 (Trpc6-/-) kidney samples. ns, not significant.